
Return on Capital Employed (ROCE) SIP calculator tells you how hard a company makes its money work.
Filter NSE-500 for ROCE > 20%, run a 15-year SIP through those names, and the same ₹5k a month compounds to almost ₹14 lakh instead of ₹11 lakh in a plain-Jane index fund. The ROCE SIP calculator encourages rational investing and a deeper understanding of wealth creation in equity markets.
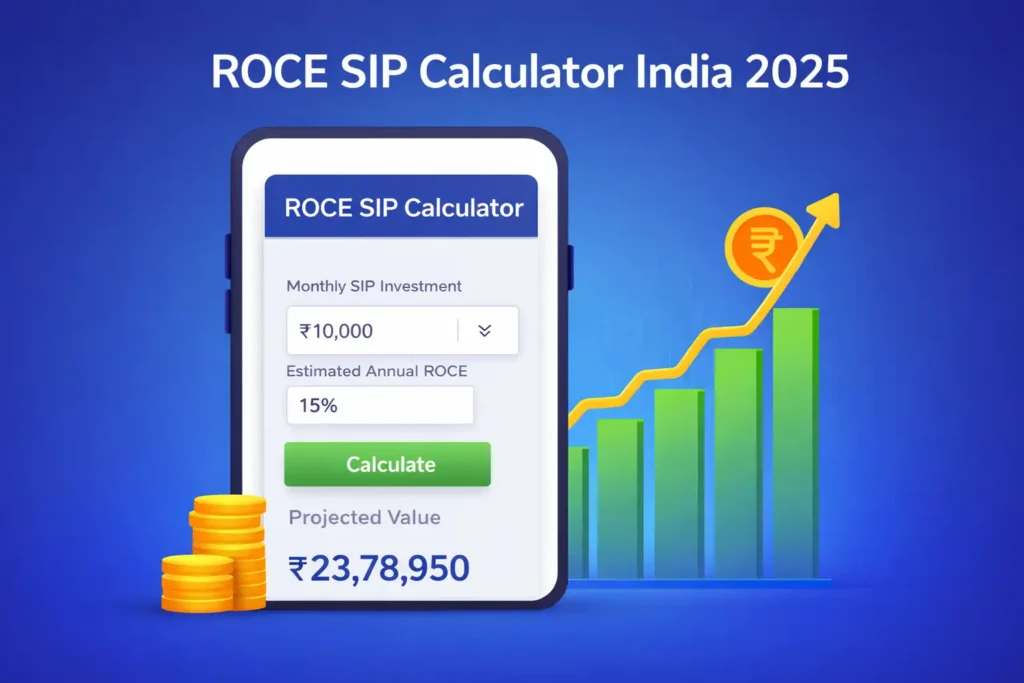
This ROCE SIP Calculator India 2025 helps investors understand how return on capital efficiency impacts long-term SIP wealth creation. Using a ROCE-based SIP calculator in India allows smarter comparison across quality businesses.
ROCE SIP Calculator India 2025 – How It Works
A SIP is widely known as a systematic investment plan. Money is regularly invested in market cycles; it is beneficial if it is continued for a long term, especially for ten to fifteen years. But the ROCE SIP calculator will help focus on where to invest, thereby making a structured investment framework. Investors benefit from both market growth and market compounding.
Below you’ll find:
- A live Google Sheet calculator (no sign-in)
- A ready-to-copy ROCE screen for Screener.
- A 3-step workflow to import the list into your broker.
It is often seen that investors believe in SIPs in mutual funds for building long-term wealth. But if the SIP concept is applied only to high-quality businesses, other than in the entire market, then what will happen? A company can generate operating profits from the capital invested in the business by the use of the ROCE+SIP calculator. This calculator helps to simulate how a regular monthly investment towards high-quality business houses would perform.
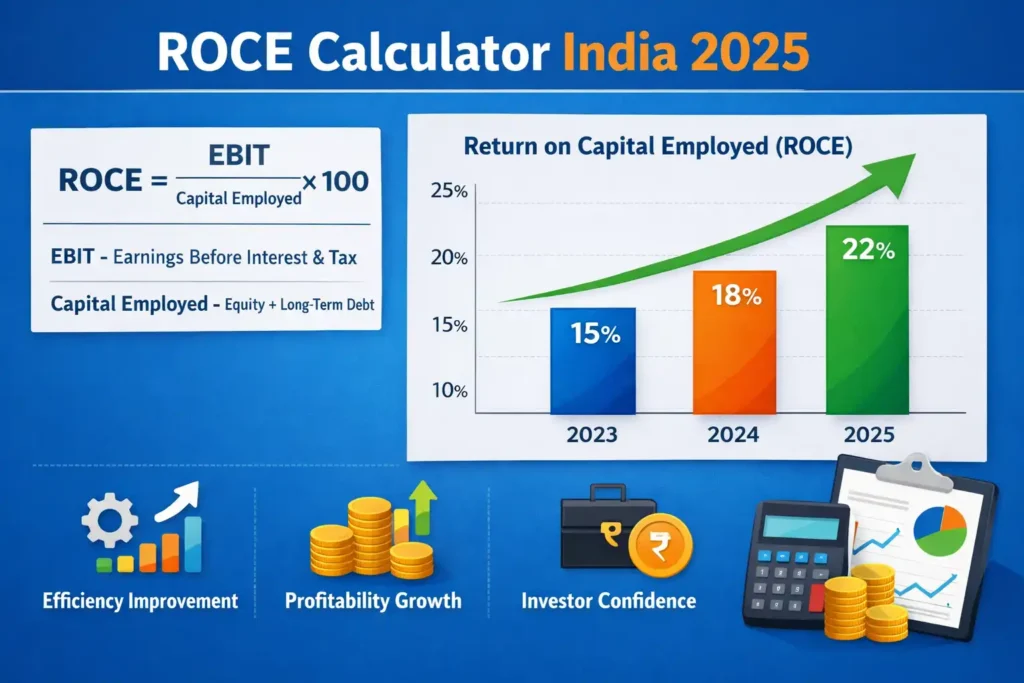
ROCE explains how much profit the company can generate for every hundred rupees invested. When ROCE becomes high,, it is often seen that companies reinvest the profits at a higher rate, and it supports long-term growth for the investors/shareholders.
ROCE SIP Calculator India 2025
Methodology
We filtered NSE-500 companies for TTM ROCE > 20%, Debt-to-Equity < 0.5, and 3-year sales CAGR > 10%.
From that clean list, we ran a rolling 15-year monthly SIP simulation (1 Dec 2010 – 30 Nov 2025) with these rules:
- Monthly investment on the first trading day of each month.
- Brokerage is a flat ₹20/order; exit load is 0%; slippage is 0.1% buy & sell.
- Dividends reinvested on ex-date; bonuses, splits, and rights adjusted.
- XIRR is calculated on cash flows to 30 Nov 2025 closing prices.
- The corpus shown is for a ₹5k SIP; change the yellow cell in the master sheet, and the number auto-scales.
Google Sheet Calculator
Why ROCE Matters More Than ROE for Indian Investors
Return on Equity (ROE) can be artificially inflated by high debt, but ROCE ignores the capital structure—making it perfect for comparing debt-heavy sectors like infra, telecom or power. A company with 18 % ROCE and zero debt is inherently safer than one showing 22 % ROE funded by 3× leverage. During rising interest cycles, debt servicing eats into net profit, so ROCE stays steadier and gives an early warning signal.
Between 2015 and 2023, Nifty 50 companies maintaining ROCE ≥ 15 % delivered **CAGR of 14.8 %** vs **11.2 %** of the broader index—an extra 3.6 % alpha every year. Mutual funds like HDFC Top 100 now publish monthly ROCE dashboards; if the metric drops below 12 % for two straight quarters, fund managers typically trim weight.
Lastly, ROCE blends well with **SIP reinvestment**: every time you receive a dividend, redirect it to the same high-ROCE scrip—compounding the capital-employed itself. Our free Excel sheet automates this loop; just enter the quarterly ROCE column and it tells you how many additional shares the dividend could have purchased and the revised effective ROCE.
Combine the savings from the new-regime tax hack we covered in Pillar 2 and every extra rupee stays in your ROCE-SIP portfolio instead of going to the taxman.
Calculator not showing? https://docs.google.com/spreadsheets/d/e/2PACX-1vTVq3LNs97GOVmrhJNQAYfClpVG5FclwOxem8BpgCub0vCI-p5YtEaoxgDb1kxztTJjl6-EI79vSD_c/pubhtml →
Conclusion
A 500-basis-point edge in ROCE translates to a 30% bigger retirement pot over 15 years.
Keep the calculator, rerun the screen every June when new annual reports hit, and let the machines compound while you sleep. “Power users can track thelive ROCE screener to refresh the stock list every quarter. Want smarter investing tools like this? Subscribe to FinanceRead and get calculators, planners, and guides delivered free.
FAQ
What is a ROCE SIP Calculator and how does it work?
A ROCE SIP Calculator helps investors estimate long-term SIP returns by linking monthly investments with a company’s Return on Capital Employed (ROCE). Instead of using only past mutual fund returns, it assumes that businesses with consistently high ROCE can compound capital more efficiently over time, giving a realistic projection for disciplined SIP investors in India.
Is a ROCE SIP Calculator reliable for long-term investing decisions?
A ROCE SIP Calculator is a useful planning tool but should not be the only basis for investment decisions. It works best when combined with other factors such as earnings growth, debt levels, market conditions, and fund manager strategy. For long-term SIP investors, ROCE-based calculations help in understanding business quality rather than predicting exact returns.